Functionallity#
The main features#
Operates in two modes gravity monitoring and configuration mode
In
gravity monitoringmode it behaves just like the iSpindle, it wakes up at regular intervals, measures angle/tile, temperature, calculates gravity and pushes the data to defined endpoints.In
configuration modethe device is always active and the webserver is active. Here you can view the angle/tilt values, change configuration, update the gravity formula. When in this mode you can also interact with the device via an REST API so data can be pushed to the device via scripts (see API section for more information).
You can force the device into
configuration modewhile measuring gravity. This is useful when calibrating the device so you don’t needs to wait for the device to wake up and push the data. The entire calibration sequence can be handled via the web interface without need for additional software tools.See the Configuration section for more information on how to trigger the configuration mode.
Can send data to multiple endpoints
The original iSpindle can only have one destination, this software will push data to all defined endpoints so in theory you can use them all. However this will consume more battery power so use only as many as needed. Its much more efficient to have the endpoints on your local network than on the internet.
Currently the device supports the following endpoints.
http or https
influxdb v2
Brewfather
MQTT
Home Assistant
Brew Spy
Brewers Friend
Fermentrack
Ubidots
Thingsspeak
Under the Service Integration section you can find guides for how to connect GravityMon to these services. For a description of what data is transmitted you can see Data Formats.
The software support SSL endpoints but currently without CA validation, this means that the data is encrypted but it does not validate if the remote endpoint is who it claims to be.
if you require CA validation please leave a comment on GitHub and I will make that a priority. Adding this function will dramatically reduce the battery life of the device.
Note
Using SSL on a small device such as the esp8266 can be unstable since it requires a lot of RAM to work. And running out of RAM will cause the device to crash. So enable SSL with caution and only when you really need it. GravityMon will try to minimize the needed RAM but the remote service might not support that feature.
Create gravity formulas on the device
Another big difference is that this software can create the gravity formula in the device, just enter the angle/gravity data that you have collected. You will also see a graph simulating how the formula would work.
Currently the device can handle 5 data points which should be enough to get a accurate formula. At least 3 data points is needed to get an accurate formula.
If there is a need for more data points, raise a comment on github.
Customize the data format beeing sent to push targets
In order to make it easier to support more targets there is a built in format editor that can be used to customize the data that is to be sent. This way you can easily adapt the software to new targets without coding. If you have a good template please share it on the github repository and I will add it to the documentation for other users to enjoy. See the Format editor for more information. See Service Integration for a list of services currently validated.
Automatic temperature adjustment of gravity reading
If you want to correct gravity based on beer temperature you can do this in the formula but here is a nice feature that can correct the gravity as a second step making this independant of the formula.
OTA support from webserver
When starting up in configuration mode the device will check for a software update from a webserver. This is an easily way to keep the software up to date. In the future I might add a hosted endpoint for providing updates.
DS18B20 temperature adjustments
You can adjust the temperature reading of the temperature sensor. In normal cases this should not be needed since the sensors should be calibrated.
Gyro Movement
The software will detect if the gyro is moving and if this is the case it will go back to sleep for 60seconds. This way we should avoid faulty measurements and peaks in the graphs.
WIFI connection issues
The software will not wait indefiently for a wifi connection. If it takes longer than 20 seconds to connect then the device will go into deep sleep for 60 seoncds and then retry later. This to conserve batter as much as possible.
Use gyro temperature sensor
This works fine when the device has time to cool down between measurements and it saves up to 400 ms. My testing shows that this is quite accurate with a deviation of less than 0.3C. This reduces the run time by 20% (with optimal wifi connection).
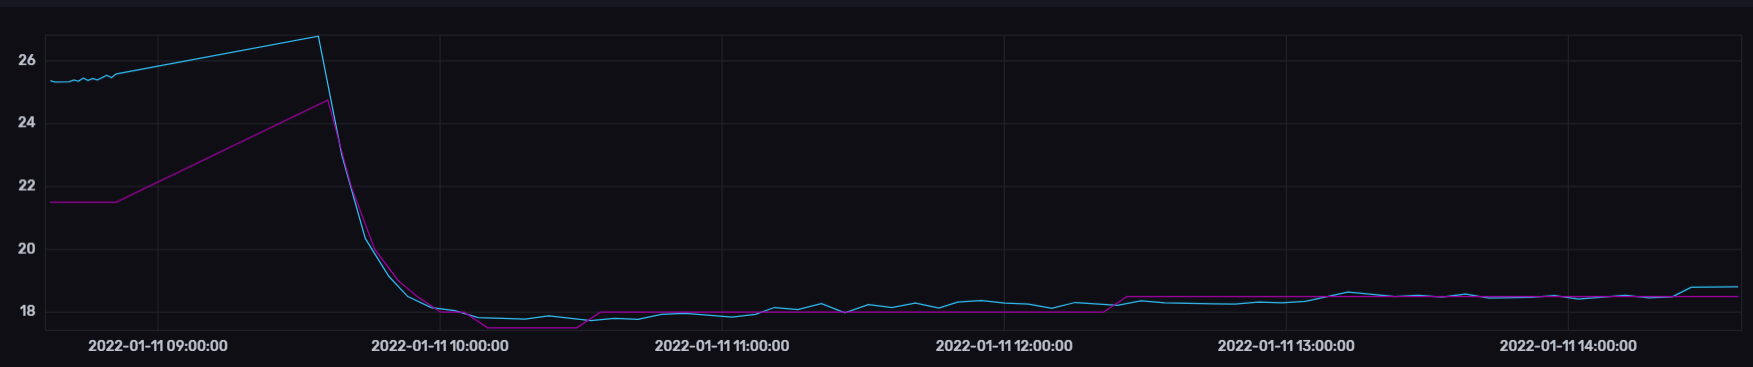
The graph below compares from the temp from two different devices in the same bucket of water. One with gyro temp enabled and one with the DS18B20 sensor. The blue line is the gyro temperature and this clear that the temperature will be higher after it has been running but cools down when in sleep mode. The interval has been set to 300s. A low delay of 30s will not allow the gyro to cool down and the temperature will be 0.5-1.0C higher.
Celsius or Farenheigt
You can switch between different temperature formats. GravityMon will always use C for it’s internal calculations and convert to F when displayed.
SG or Plato
You can switch between different gravity formats. GravityMon will always use SG for it’s internal calculations and convert to Plato when displayed.
Stable gyro data
The device will read the gyro 50 times to get an accurate reading. If the standad deviation is to high it will not use the data since this is inacurate and the device is probably moving, probably do to active fermentation or movement of fermentation vessel. This sequence takes 900 ms seconds to execute and besides wifi connection this is what consumes the most battery. With more testing this might be changes to either speed up or provide more stable readings.
Performance measurements
I’ve also create a small library to measure execution code in some areas of the code that i know is time consuming. This way I can find a good balance between performace and quality. This is a lot of help trying to figure out where bottlenecks are in the code and where to put optimization efforts. Examples of real measurements:
Reading the gyro: 885 ms
Reading DS18B20 temperature sensor: 546 ms
Connect to WIFI: 408 ms
Send data to local influxdb v2: 25 ms
Send data to local mqtt server: 35 ms
Send data to local http server: 40 ms
Send data to http server on internet: 0.2 - 5 seconds
See the Compiling the software for more information.
Power measurements
I’ve also create a project to measure the power consumption of the device, but more on this later.
Battery life#
The long term battery test has now been completed. Using a 2200 mA battery and sending data every 5 minutes to a local server on my network. The battery lasted 47 days which is excellet battery life.
In another test I had a device running with an sleep interval of only 30s with ok wifi connection. The device lasted 12 days which i think is excellent considering the short sleep interval.
From what I have discovered it’s the WIFI connection or latency to internet hosted that has the most impact on the battery life. The typical runtime in the tests above was around 2 seconds.
Performance#
Since I have the possibility to measure the performance of different function in the code this is what I have been able to gather.
The typical runtime in a measurement cycle is approx 2 seconds and in some cases it can take up to 6-8 seconds but this is mainly related to establishing the WIFI connection. So stable wifi is essential for long batterylife. Out of the 2 seconds of run-time the major time is spent on gyro readings (1.3s) and temperature measurements of (0.6s) so using the gyro sensor for measureing temperature would reduce the total runtime with 25%. Sending data over http takes less than 100ms (on my local network) so this is not drawing much power.
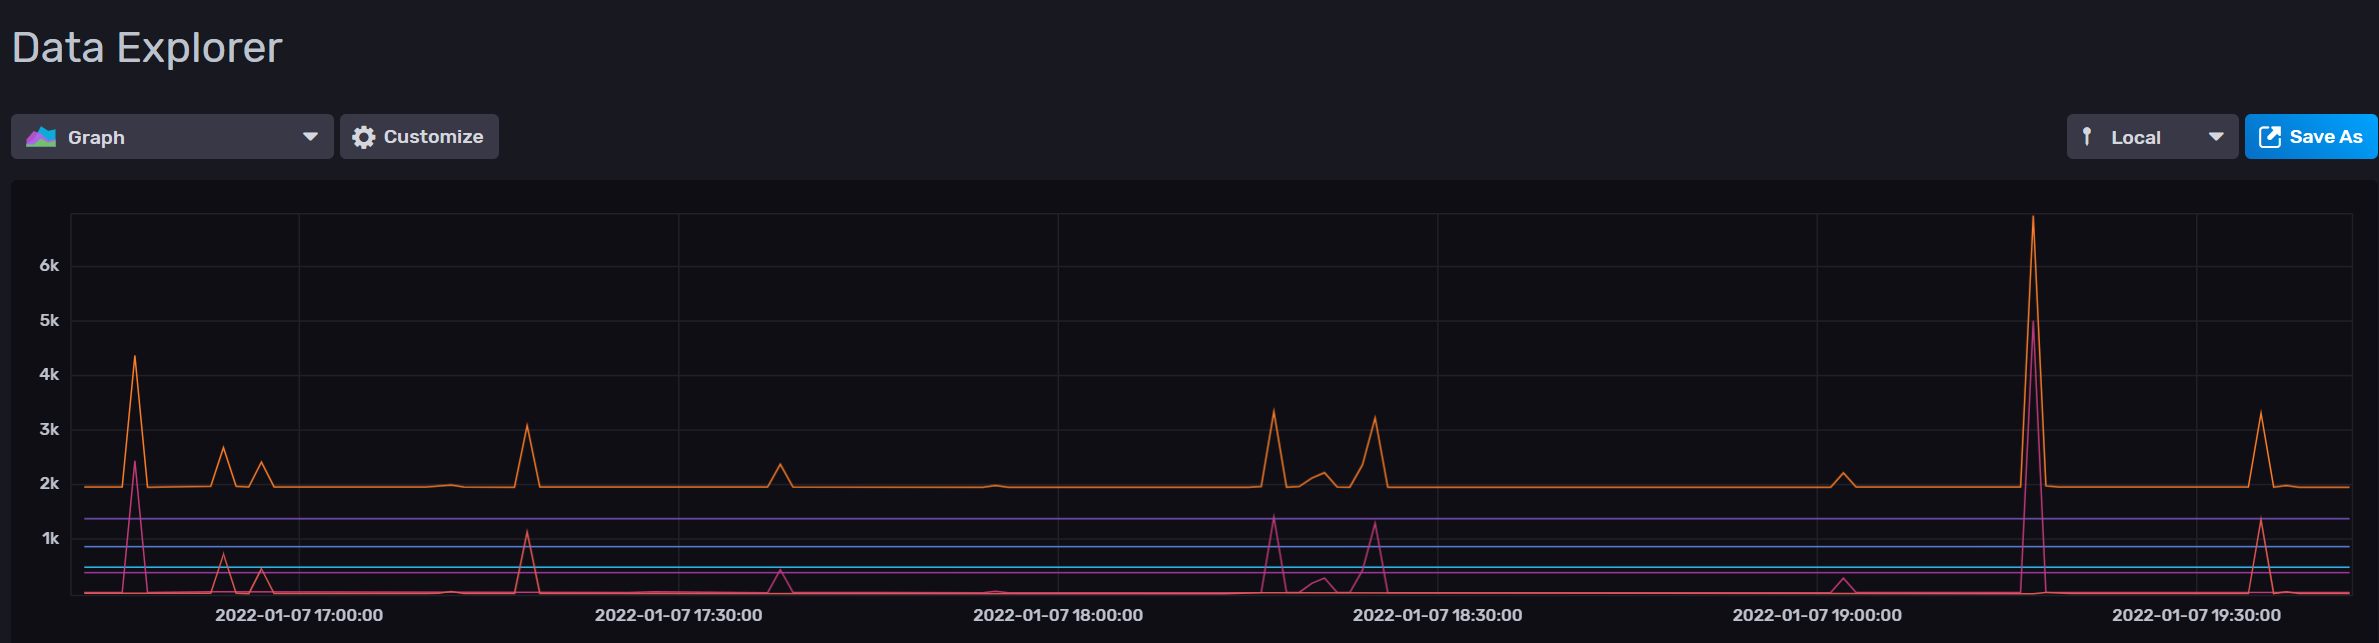
The image below shows how the run-time varies over time. The pink line is the wifi connection time and this is why the time varies. The orange is the total runtime for the awake period.